Purpose
The indicator is intended for manual multi-currency trading based on the Triple Screen Strategy.It works with any symbols located in the Market Watch window of the MT4: currencies, metals, indexes, etc.
The number of instruments can be limited by capacity of the МТ4's parameters. But if desired, you can create several windows with various set of instruments and parameters.
Operation Principle
The indicator uses the modified Triple Screen Strategy for determining trend direction in the third window via Awesome Oscillator, Moving Average or Stochastic Oscillator at the trader's discretion. The oversold/overbought level is determined in the second window via Stochastic indicator. We also use Stochastic indicator in the first window, but this time we are determining the best market entry point. As a result, we obviate the necessity to move pending orders according to the market (what the classical system requires) and can enter the market at once.Target Audience
The indicator will be useful for those who prefer multi-currency trading.If you use the Triple Screen Strategy, you have to analyze three time periods for each instrument. You need a lot of time to work with a large number of symbols. We created this indicator to facilitate this work. It independently analyzes all chosen instruments by three time periods. When it finds the required combination of parameters' values, it notifies a trader about a possibility to perform a trade.
The trader only needs to specify parameters which will be used by the indicator to check the possibility to perform the trade with given instruments.
Features
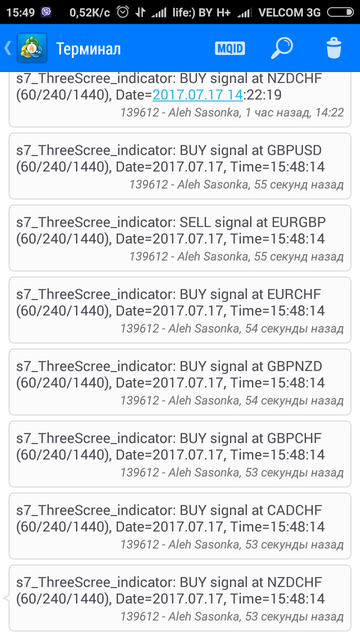
The indicator informs the trader about the possibility to perform the trade by means of a message popping up on the screen, sending message to an e-mail or a mobile terminal, or just by a sound notification.The indicator works with current prices (uses the zero bar).
To reduce the CPU load, it is possible to customize the period for redrawing the indicator values.
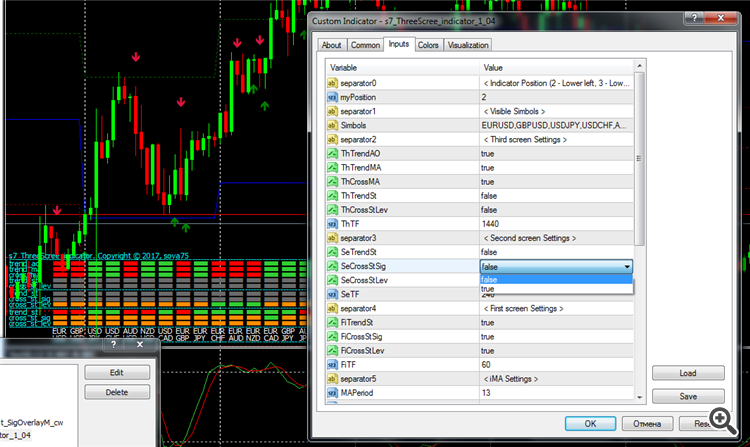
Input parameters
- Indicator_Position
- myPosition - indicator location in the main window of the chart (lower left, lower right)
- Visible_Symbols
- Symbols - enter the instruments for tracking (separated by commas, without spaces)
- Third_screen_Settings
- ThTrendAO - trend direction based on the Awesome Oscillator indicator on the third screen (true - enable, false - disable)
- ThTrendMA - trend direction based on the Moving Average indicator on the third screen (true - enable, false - disable)
- ThCrossMA - price above/below the Moving Average indicator line on the third screen (true - enable, false - disable)
- ThTrendSt - trend direction based on the Stochastic Oscillator indicator on the third screen (true - enable, false - disable)
- ThCrossStLev - the main value of Stochastic Oscillator above/below the oversold/overbought level on the third screen (true - enable, false - disable)
- ThTF - timeframe of the third screen in minutes (1440=D1, 240=H4, 60=H1, etc.)
- Second_screen_Settings
- SeTrendSt - trend direction based on the Stochastic Oscillator indicator on the second screen (true - enable, false - disable)
- SeCrossStSig - intersection of the signal line by the main line of the Stochastic Oscillator on the second screen (true - enable, false - disable)
- SeCrossStLev - the main value of Stochastic Oscillator above/below the oversold/overbought level on the second screen (true - enable, false - disable)
- SeTF - timeframe of the second screen in minutes (1440=D1, 240=H4, 60=H1, etc.)
- First_screen_Settings
- FiTrendSt - trend direction based on the Stochastic Oscillator indicator on the first screen (true - enable, false - disable)
- FiCrossStSig - intersection of the signal line by the main line of the Stochastic Oscillator on the first screen (true - enable, false - disable)
- FiCrossStLev - the main value of Stochastic Oscillator above/below the oversold/overbought level on the first screen (true - enable, false - disable)
- FiTF - timeframe of the first screen in minutes (1440=D1, 240=H4, 60=H1, etc.)
- iMA_Settings
- MAPeriod - averaging period for calculation of the indicator
- MAMethod - averaging method
- MAAppliedPrice - applied price
- iStochastic_Settings
- StKPeriod - period (number of bars) for calculating the %K line
- StDPeriod - averaging period for %D line calculation
- StSlowing - value of slowing
- StMethod - averaging method
- StPriceField - select the price for calculations
- StHighLevel - overbought level
- StLowLevel - oversold level
- Alert_Settings
- UseAlert - display alerts in a pop-up window (true - enable, false - disable)
- UseSendMail - send notifications to e-mail (true - enable, false - disable)
- UseSendPush - send notifications to the mobile terminal (true - enable, false - disable)
- UseSound - use sound notifications (true - enable, false - disable)
- UseSoundFile - path to the audio file
- StepAlertMin - interval between notifications in minutes
- StepCalcSec - interval to recalculate the functions in seconds (redrawing the indicator)
- Color_scheme
- ClrTips - color for labels and the indicator grid
- ClrText - color to indicate the instruments and periods
- ClrUp - color for the bullish trend signals
- ClrDown - color for the bearish trend signals
- ClrNt - color for the neutral signals
- ClrOff - color for the disabled signals
Display
- green - buy signal;
- red - sell signal;
- orange - neutral signal;
- gray - parameter is disabled.
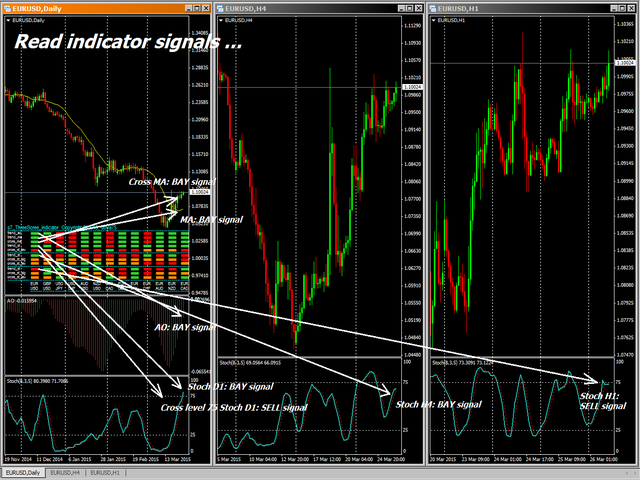
How to use
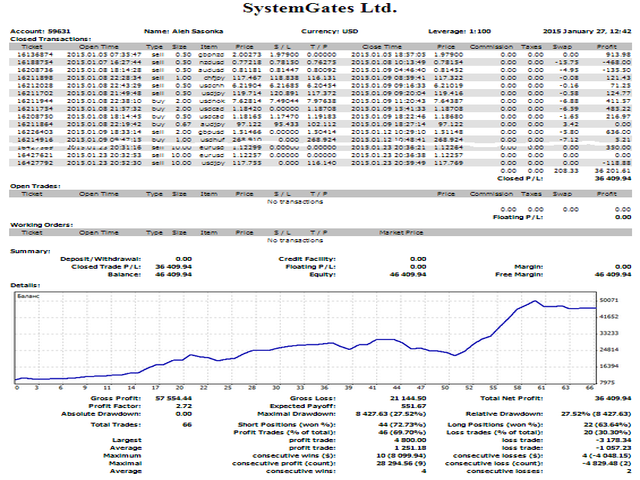
Screenshots below indicate an example of trading using this indicator.The indicator was developed for the contest of traders using manual trading based on the Triple Screen Strategy (you can see the results on the last screenshot).


Here is the updated menu MultiSymbol Triple Screen Trading System V. 1.43


The message will be received only when all the signals (indicators) coincide in one instrument (pair)!

In order to receive more messages (signals) - limit the number of indicators (indicators). In the settings opposite the signal, put FALSE.
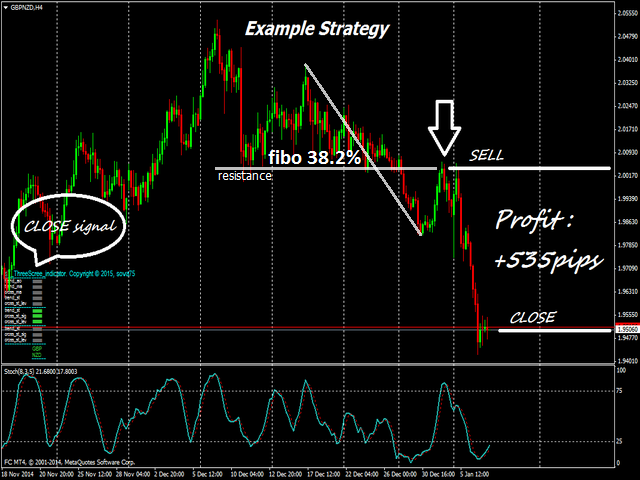
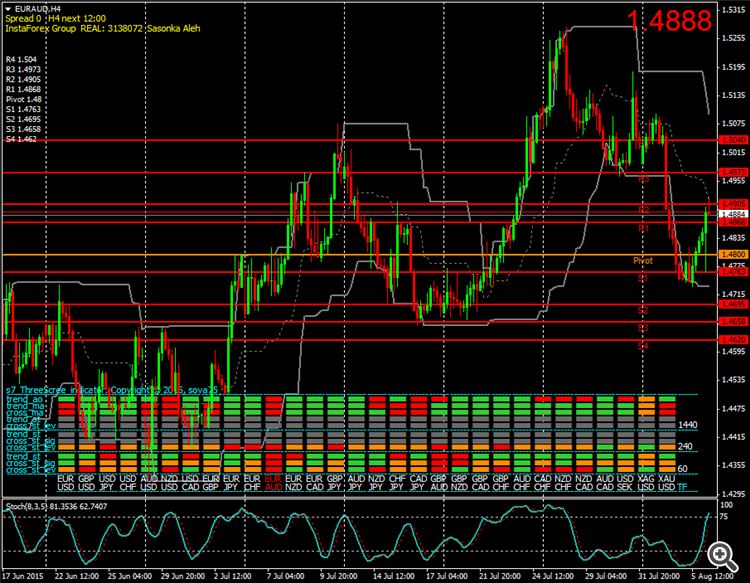
The sample input for strategy the reversal of Fibo level
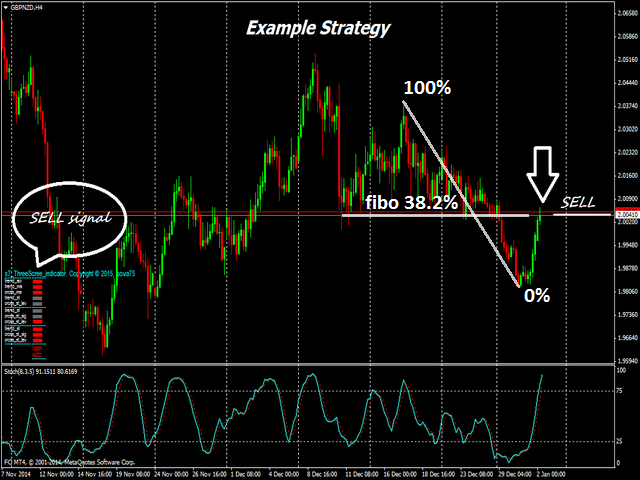
Example of rendering signal for sale pair EURAUD.
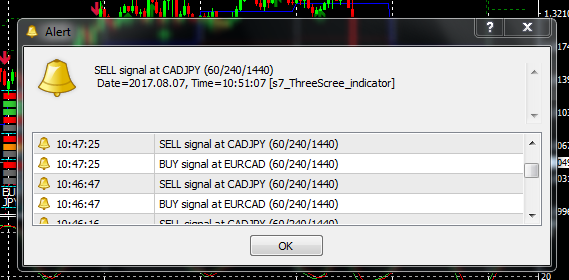
An example of the appearance of the ALERT window with the signals for several couples
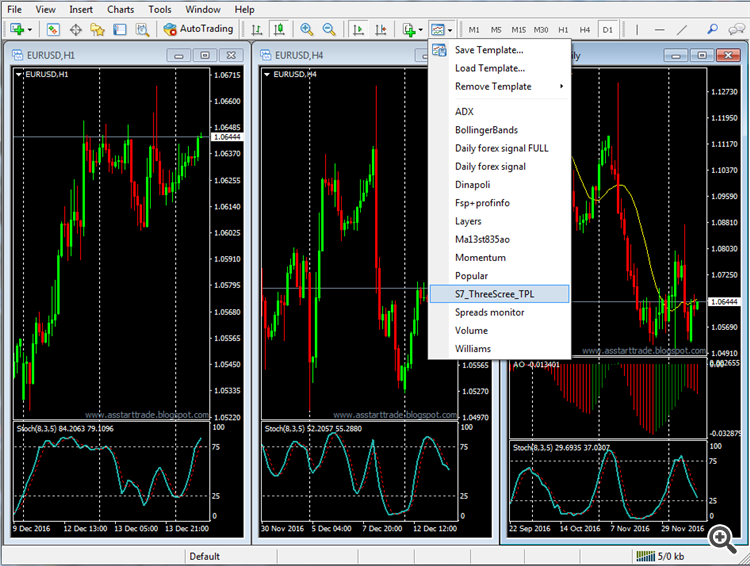
I attach a file with a template for monitoring positions on three charts H1/H4 / D1 with configured indicators for each separately.
To use, put the file in the \templates folder, restart the terminal, open three charts for the desired symbol and set the template s7_ThreeScree_TPL for each (right - click on the chart-Template/s7_ThreeScree_TPL).
Files: s7_ThreeScree_TPL.tpl (2 kb).
Here is the terminal with three charts template s7_ThreeScree_TPL.
Example indicator settings separately for opening and closing positions:
s7_ThreeScree_indicator_1_03_open.set - to open
s7_ThreeScree_indicator_1_03_close.set - to close
Can be placed on the same graph indicator with settings for open positions, and the other indicator settings to close positions.
To use, put the files in the folder \MQL4\Presets, and then in the window with the settings of the indicator press the LOAD button and select the desired template.
Files:
It is most convenient to check the work of the indicator in the strategy tester. Change the settings of the indicator and check the number of messages for the period in the magazine.
2017.12.13 13:02:34.146 2017.08.30 23:53:17 EURAUD,H1: 51785 tick events (1025 bars, 52785 bar states) processed in 0:00:33.945 (total time 0:00:36.067)
2017.12.13 13:02:32.562 2017.08.30 19:50:35 s7_ThreeScree_indicator_MQL5 EURAUD,H1: Alert: s7_ThreeScree_indicator: SELL signal at GBPCHF (60/240/1440)\n Date=2017.08.30, Time=19:50:35
2017.12.13 13:02:32.492 2017.08.30 19:40:28 s7_ThreeScree_indicator_MQL5 EURAUD,H1: Alert: s7_ThreeScree_indicator: SELL signal at GBPCHF (60/240/1440)\n Date=2017.08.30, Time=19:40:28
2017.12.13 13:02:32.432 2017.08.30 19:30:20 s7_ThreeScree_indicator_MQL5 EURAUD,H1: Alert: s7_ThreeScree_indicator: SELL signal at GBPCHF (60/240/1440)\n Date=2017.08.30, Time=19:30:20
2017.12.13 13:02:32.352 2017.08.30 19:20:13 s7_ThreeScree_indicator_MQL5 EURAUD,H1: Alert: s7_ThreeScree_indicator: SELL signal at GBPCHF (60/240/1440)\n Date=2017.08.30, Time=19:20:13
2017.12.13 13:02:32.272 2017.08.30 19:10:04 s7_ThreeScree_indicator_MQL5 EURAUD,H1: Alert: s7_ThreeScree_indicator: SELL signal at GBPCHF (60/240/1440)\n Date=2017.08.30, Time=19:10:04
2017.12.13 13:02:32.192 2017.08.30 19:00:00 s7_ThreeScree_indicator_MQL5 EURAUD,H1: Alert: s7_ThreeScree_indicator: SELL signal at GBPCHF (60/240/1440)\n Date=2017.08.30, Time=19:00:00
2017.12.13 13:02:28.121 2017.08.30 09:57:15 s7_ThreeScree_indicator_MQL5 EURAUD,H1: Alert: s7_ThreeScree_indicator: BUY signal at EURAUD (60/240/1440)\n Date=2017.08.30, Time=09:57:15
2017.12.13 13:02:28.071 2017.08.30 09:50:15 s7_ThreeScree_indicator_MQL5 EURAUD,H1: Alert: s7_ThreeScree_indicator: SELL signal at AUDCAD (60/240/1440)\n Date=2017.08.30, Time=09:50:15
2017.12.13 13:02:28.041 2017.08.30 09:47:15 s7_ThreeScree_indicator_MQL5 EURAUD,H1: Alert: s7_ThreeScree_indicator: BUY signal at EURAUD (60/240/1440)\n Date=2017.08.30, Time=09:47:15
2017.12.13 13:02:27.981 2017.08.30 09:40:15 s7_ThreeScree_indicator_MQL5 EURAUD,H1: Alert: s7_ThreeScree_indicator: SELL signal at AUDCAD (60/240/1440)\n Date=2017.08.30, Time=09:40:15
2017.12.13 13:02:27.961 2017.08.30 09:37:15 s7_ThreeScree_indicator_MQL5 EURAUD,H1: Alert: s7_ThreeScree_indicator: BUY signal at EURAUD (60/240/1440)\n Date=2017.08.30, Time=09:37:15
2017.12.13 13:02:27.901 2017.08.30 09:30:15 s7_ThreeScree_indicator_MQL5 EURAUD,H1: Alert: s7_ThreeScree_indicator: SELL signal at AUDCAD (60/240/1440)\n Date=2017.08.30, Time=09:30:15
2017.12.13 13:02:27.871 2017.08.30 09:27:15 s7_ThreeScree_indicator_MQL5 EURAUD,H1: Alert: s7_ThreeScree_indicator: BUY signal at EURAUD (60/240/1440)\n Date=2017.08.30, Time=09:27:15
2017.12.13 13:02:27.810 2017.08.30 09:20:15 s7_ThreeScree_indicator_MQL5 EURAUD,H1: Alert: s7_ThreeScree_indicator: SELL signal at AUDCAD (60/240/1440)\n Date=2017.08.30, Time=09:20:15
2017.12.13 13:02:27.729 2017.08.30 09:10:15 s7_ThreeScree_indicator_MQL5 EURAUD,H1: Alert: s7_ThreeScree_indicator: SELL signal at AUDCAD (60/240/1440)\n Date=2017.08.30, Time=09:10:15
2017.12.13 13:02:27.729 2017.08.30 09:10:15 s7_ThreeScree_indicator_MQL5 EURAUD,H1: Alert: s7_ThreeScree_indicator: BUY signal at EURAUD (60/240/1440)\n Date=2017.08.30, Time=09:10:15
2017.12.13 13:02:27.659 2017.08.30 09:00:15 s7_ThreeScree_indicator_MQL5 EURAUD,H1: Alert: s7_ThreeScree_indicator: SELL signal at AUDCAD (60/240/1440)\n Date=2017.08.30, Time=09:00:15
2017.12.13 13:02:27.659 2017.08.30 09:00:15 s7_ThreeScree_indicator_MQL5 EURAUD,H1: Alert: s7_ThreeScree_indicator: BUY signal at EURAUD (60/240/1440)\n Date=2017.08.30, Time=09:00:15
2017.12.13 13:02:00.209 s7_ThreeScree_indicator_MQL5 inputs: myPosition=2; ThTrendAO=1; ThTrendMA=1; ThCrossMA=1; ThTrendSt=0; ThCrossStLev=0; ThTF=1440; SeTrendSt=0; SeCrossStSig=0; SeCrossStLev=1; SeTF=240; FiTrendSt=1; FiCrossStSig=1; FiCrossStLev=1; FiTF=60; MAPeriod=13; MAMethod=1; MAAppliedPrice=0; StKPeriod=8; StDPeriod=3; StSlowing=5; StMethod=0; StPriceField=0; StHighLevel=75; StLowLevel=25; UseAlert=1; UseSendMail=0; UseSendPush=0; UseSound=0; StepAlertMin=10; StepCalcSec=60;
2017.12.13 13:02:00.209 Custom indicator s7_ThreeScree_indicator_MQL5 EURAUD,H1: loaded successfully
2017.12.13 13:02:00.189 TestGenerator: unmatched data error (high value 1.50246 at 2017.08.30 13:00 is not reached from the least timeframe, high price 1.50244 mismatches)
2017.12.13 13:01:58.086 TestGenerator: current spread 49 used
2017.12.13 13:01:28.702 Expert s7_ThreeScree_indicator_MQL5 EURAUD,H1: loaded successfully
THE TRADING RESULT ON THE TRIPLE SCREEN ELDER
For trading, a simplified scheme of The three elder Screen strategy is used.
Periods D1-H4-H1 were used.
On the third screen D1 trend was controlled by indicators Awesome Oscillator and Moving Average with a period of 13. The trend is determined when the direction of the indicators coincides and the price crosses the MA line in the same direction.
On the second H4 was determined by the level of the overbought/oversold indicator in the Stochastic Oscillator with options 8,3,5. The sell signal was used to cross the level 75, to buy - 25.
The first H1 defines a more accurate time to enter with the same settings as the second.
The entry was made by a market order after determining the position of the price relative to the support/resistance levels with the stop moving beyond the level.
Output by changing the signal to the opposite on the second screen.
Trading was conducted on the contest account from 05 to 23 January (3 weeks).
Initial Deposit 10 000. Shoulder 1: 100.
Trading result:
- Net profit 36 409 (364%)
- Profitability 2,72
- Relative drawdown 27%
Update to version 1.44
What's new: A section with font settings (font size and name) has been added to the input parameters.

Category: Indicators
Author: Aleh Sasonka
Published: 31 March 2015
Current version: 1.44
Updated: 1 August 2019
Buy the 'MultiSymbol Triple Screen Trading System' Technical Indicator for MetaTrader 4 in MetaTrader Market.html!
No comments:
Post a Comment