This triple screen trading system was developed by Dr Alexander Elder.
This is a mechanism which goes through the practical examination of a stock in three different stages.
In order to qualify for trading, a stock must pass through all three different stages with positive marking.
This is a mechanism which goes through the practical examination of a stock in three different stages.
In order to qualify for trading, a stock must pass through all three different stages with positive marking.
Step 1
It is found that if a stock does not qualify for any of the stage; it does not qualify for the next step.
We must keep in our mind that all the three stages must positively allow the stocks to get ahead.
No compromise in the process of selection is accepted. This process requires the first two stages of the study on a weekend. It means that one can start examining this process only after the weekly closing is over.
Hence, it is of no use to study this process in between the week.
Once the weekly closing is over, we should open the weekly chart and plot at least three trends following indicators. They are as follows:
1. MACD
2. Directional system
3. 13 and 30 Moving average
In order to make a positive marking, all the three indicators have to give confirmation. The ideal situation would be as follows-
a. Both the lines in MACD i.e. solid line and the trigger line should be above zero and both rising.
b. In the directional system, +DI is rising on the upside and –DI is falling on the downside and ADX is in between the two and rising.
c. 13 and 30 weeks moving average line should be such that 13 weeks > 30 weeks and both are rising.
If all of the above three are showing the positive sign, then we can reasonably say that the trend is up. The trend identification process has to be on a weekend basis.
The examination report will allow us to take a positive decision.
If during the course of the examination, if any of the indicators is not dancing on the same tune, then the entire process stands disqualified.
That is the reason that all three indicators must behave in the same manner and when all the three gives a positive signal, then we will move to the second step.
Example
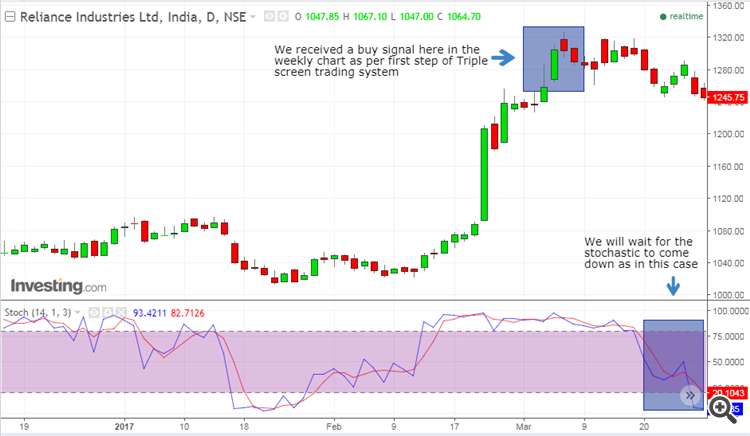
Let’s take an example to understand the first step. The below is the chart of Reliance Industries and we can clearly see that the all the three i.e. 13,30 moving average, MACD and the Directional system gives a positive buy signal in the weekly chart above 1250 levels (approx).
Step 2
The second step deals with the identification of the status of momentum.
In order to do such, we will open the daily chart, plot and take the help of stochastic only. We should not forget that stochastic catches the short term momentum.
Let us now try to understand that the trend has been identified in the weekly chart with the indicators which are laggard in nature.
Hence it may happen that although the weekly chart shows an uptrend it has started momentum sometime back.
Hence it may happen that in the process the stock has reached already a short-term overbought situation.
So even if the weekly chart allows a positive trend, the stochastic in daily chart might say the other way round.
Here, we are actually making a combination of a trend that is in the direction and the momentum.
As we can see in the chart below that when we received the buy signal in the weekly chart, the stochastic was in the overbought zone.
So we will wait for the short-term correction to fulfil the criteria of the second step. Accordingly, the stock gave a correction and the stochastic travelled all the way to oversold zone.
Step 3
Once we have crossed the first two steps, the question of third step or the final step where the action is required to be taken.
If the first scenario gives us a proper signal of the uptrend and stochastic has remained in the falling or oversold condition, it means that the price has been falling and of course making a lower top and lower bottom.
To take an entry for buy, we should allow the price to close above the top of the previous high and of course, low has to be higher in comparison to the previous day.
Thus it will create a higher top and higher bottom which also confirms that the downtrend or the correction is over and the price has started creating the higher top and higher bottom.
If this happens, stochastic will also turn for a buy signal. Needless to say that we will hold the position trailing our stop to previous day’s low and will finally liquidate when the stochastic is overbought.
In case of the downtrend in the weekly chart, we will wait for a selling decision when the stochastic is up. Since stochastic is up, it means price was rallying in the nature of relief rally.
Once price breaks, the last day’s bottom and makes a lower top, the sell signal is triggered.
We will keep our position sold and trail our stock gradually to the downside where yesterday’s high would be trailing stop. We can book the profit when stochastic is finally oversold.
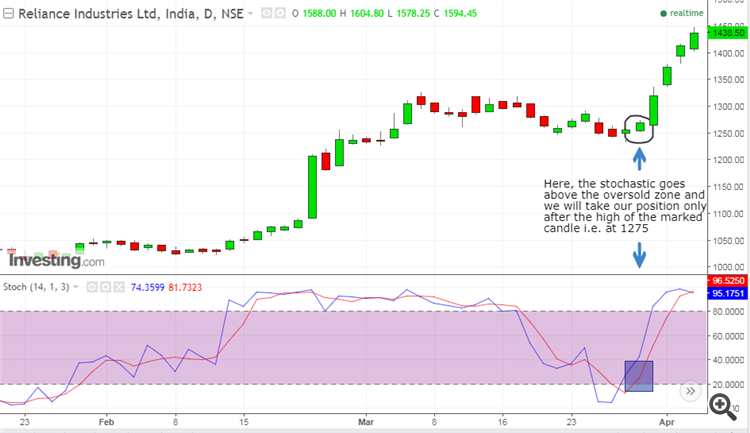
Here, we will make our position when the stochastic rises above the oversold zone.
We will enter only above the high of the marked candle in the chart.
After the buy signal was generated, the stock gave a good 150-160 point rally and it’s very important to keep trailing our stop loss in the process.
Bottomline
The same concept can be applied in combination of weekly chart and monthly chart where the trend has to be decided in the monthly chart and stochastic to be applied in the weekly chart and we will allow other rules as applicable.
Tools for work
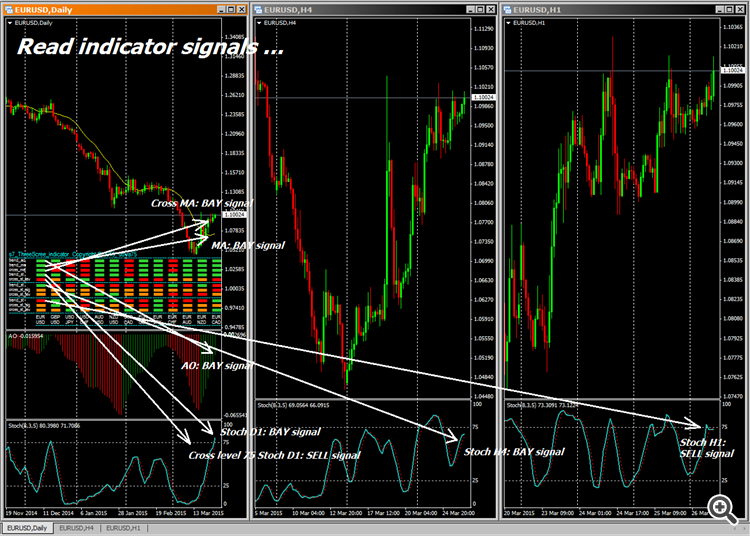
Indicator MultiSymbol Triple Screen Trading System is used to trade on multiple currency pairs and monitors the signals from three time periods at once for 30 currency pairs and provides information in a graphical form on the same graph.


No comments:
Post a Comment