30 pip metod
This is an amazing strategy which can net you 20 - 30 pips every day. Once you hit 20 pips for the day stop. Trade this strategy either 1 hour after the London Open or if you are in USA, trade it between 9:00 am and 10:00 am during the New York session for the best results. Now and then you may see a setup a little later then this and you can take that one also. Works best on the EURAUD, EURUSD, GBPUSD, GBPCHF and EURCHF currency pairs. The EURAUD is the easiest. Others currency pairs can also work such as USDCAD and EURJPY. Attach the template with the indicators to each of the charts for these currency pairs.Getting Started:
1. You will find the 30pip indicator, ProCCI and Time to next bar indicators in the zip file you downloaded. Open the zip file then copy and paste all of the indicators to the experts/indicators folder of your Metatrader. Attach these 3 indicators to your chart or use the template provided.2. Place the 30pip.dll file in the experts/libraries folder
3. Note: You have to enable the option "Allow DLL imports" in your Metatrader. Go to Tools -> Options -> Expert Advisors tab then check "Allow DLL imports" then uncheck the box that says “confirm DLL function calls” Click OK Close the Metatrader and open it up again
4. You will see message “successfully loaded” if you are activated. If not see below.
Template For your convenience we have provided you with a template. After you put the indicators provided into your experts/indicators folder for your Metatrader, you can load the template. Put the template into the templates folder of your Metatrader and you can attach it to your chart and see all of the indicators ready for trading! This is the easiest way to start.
The most important indicator is the 30pip indicator. This is the indicator that draws the arrows on your chart. You will also get ProCCI indicator. The ProCCI gives you a good overall view which puts you in tune with the market action and will also help you exit.
Entry Rules
Time Frames and Currency Pairs
On the EURUSD - You can trade on a 1 minute chart for lots of scalping or on a 5 minute chart All of the rest of the currency pairs use the 5 minute chart only
There are just 2 Steps for you to follow.
Step 1
Look for the colored arrows on your chart. They tell you what to do. There are 3 kinds of arrows for you to consider.
High Probability Trades:
RED arrow for a SELL
BLUE arrow for BUY.
These trades have the best chance for success as everything is lined up perfectly. This is the best.
Aggressive Trade:
Yellow arrow pointing down for a SELL or up for BUY
These trades are more aggressive. Often these are still very good trade opportunities but you should use a smaller lot size when trading these. See money management below.
White Hot Trades:
White arrow pointing down for a SELL or up for a BUY.
These are trades where the price is bouncing off of the support or resistance lines on your chart. These are higher risk trades which can go in the right direction for huge profit. The white hot trades work best on the EURUSD and the GBPUSD but not as well on other currency pairs.
Step 2
After you see the arrow showing the trade direction on your chart:
For a BUY: Look for a strong bullish candle formation on next candle ( A candle that CLOSES above the OPEN price of the previous candle) Open your BUY right after it closes, (use “time to next bar” indicator which is included to help you time your entry properly) See examples below.
For a SELL look for a strong bearish candle formation on next candle (a candle that CLOSES below the OPEN price of the previous candle. Open a SELL trade right after it closes, (see examples below)
Note: Also take into strong consideration the size of the next candle mentioned in Step 2. When you enter a sell trade look for a very strong bearish candle, if you see very small candles with little volume, don't enter, wait for a good candle. Be very patient and look for very good entries
Also, If the candle is too large right after the arrow shows we will want to ignore that trade. If the bar is say 15 -20 pips or so you may want to ignore that trade as it could reverse backwards.
Wait for another opportunity.
Stop Loss:
Place a stop loss a few pips below the candle that has the colored arrow pointing
to it for a BUY or a few pips above the candle with the colored candle pointing to it for a SELL (max of 10-12 pip stop)
Money Management - Conservative Trading Style - Using a test trade
1. Arrow shows up on chart and we get the confirmation candle telling us it is time to trade.
2. Open a test trade. This trade will test the waters. It will be equal to 0.1 /$1000 in your account so if you have $2000 in account open up a 0.2 lot trade Close this trade when the ProCCI reaches +100 if you are in a BUY or -100 if you are in a sell
3. If you lost this test trade and it hits the Stop. You will do a follow up trade immediately after a loss. After you lose a trade the arrow will print again showing you a possible new entry. This is the follow up to the test trade. This time open a trade that is 3 X larger then the test trade.. If you opened up 0.1 lots open 0.3 lots for this trade. Use either of the exits you see below.
4. Conservative exit: Close this trade when the ProCCI reaches 0
5. Aggressive exit: Close the trade when ProCCI reaches +100 if you are in a BUY or -100 if you are in a sell.
Money Management Aggressive - Opening a large trade
1. BLUE or RED arrow shows on chart and we get the confirmation candle
2. Open a trade equal to 0.2 lots per $1000 in account balance
3. Conservative exit: Close this trade when the ProCCI reaches 0
4. Aggressive exit: Close the trade when ProCCI reaches +100 if you are in a BUY or -100 if you are in a sell.
Summary
1. Let the 30 pip indicator arrows show you a high probability trade set up (RED and BLUE arrows are best) It will show you the arrows and also pop up an alert box telling you a trade may be approaching.
2. Wait for the next bar to close and if it is a strong bullish or bearish bar then open trade at the open of the next candle.
3. USE the Money Management rules shown above. These are the most important rules to consider. The entry is easy for you now that you have the 30 pip indicator. The rest is the exit and the money management
4. Set your stop loss a few pips away from the candle where you see the arrow.
Trade Example 1 : EURUSD 5 minute Chart
See the different colored arrows. Each one is showing a possible trade setup is developing.
The white arrow is showing a high probability trade as the candle is touching the support line. The next candle was bearish (down) candle. Once it closed, we do a SELL at the opening of the next candle. Place the stop loss a few pips above the candle that has the arrow pointing to it.
Trade Example 2: See the yellow arrow (aggressive trade arrow). Once the next bar showed a bullish candle (UP bar) we could go long at the opening of the next candle. Place the stop loss a few pips below the candle that has the arrow pointing to it.
Trade Example 3: See the RED arrow pointing down (high probability trade arrow). Once the next bar showed a bearish candle (DOWN bar) we can do a SELL at the opening of the next candle. Place the stop loss a few pips above the candle that has the arrow pointing to it.

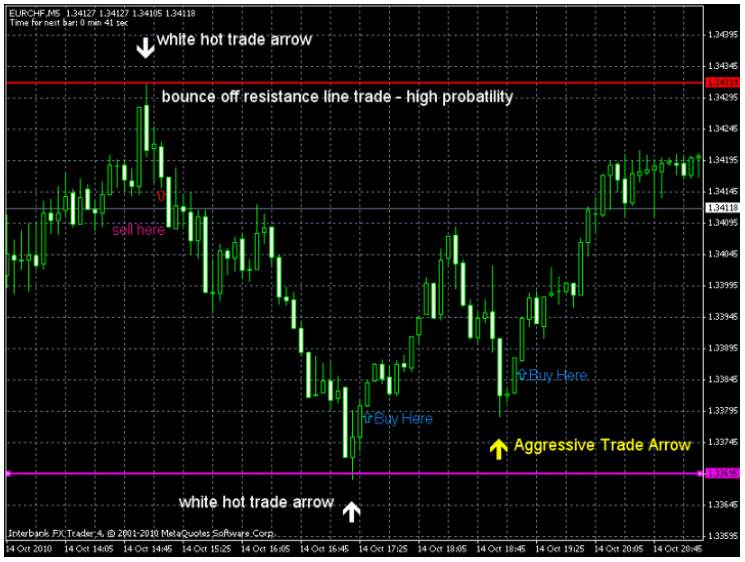
Trade Example 1: EURCHF 5 minute Chart
See the white arrows at the top or bottom of the chart. It is telling you the price touched the resistance line . The next candle was bearish candle. Once it closed, we go short at the opening of the next candle. Often times when the price bounces off of the resistance line (White arrow) and you get into the trade, you can stay in the trade until It reaches the next resistance line as you can see where we could have taken a SELL. This can result in a HUGE profit so look for these as often as possible.
Trade Example 2: See the yellow arrow (aggressive trade arrow). Once the next bar showed a bullish candle (UP bar) we go long at the opening of the next candle. Place the stop loss a few pips below the candle that has the arrow pointing to it.
Trade Example 1: GBPUSD 5 minute Chart
There are 4 possible trade opportunities on this chart. There is a white bar (white hot trade) where we could have gone short 1 candle after the white arrow appeared.
Trade Example 2: We see 2 other possible trades when the yellow arrow appeared. There were BUY opportunities after the next bar was bullish bar we would have done a BUY.
Trade Example 3: We see a BLUE arrow indicating a High Probability Trade may occur. The trade was opened after the following bar was an UP bar which is bullish and we are now in a BUY trade

Trade Example 1: EURUSD 5 minute Chart
ProCCI and Time to next bar indicators added to the chart
You can see the ProCCI indicator has been added to the chart. This indicator will help you visualize when the best time to open a trade will be. The best time to open a trade is when the 30 pip indicator prints an arrow on the chart and the ProCCI indicator is at an extreme. When the ProCCI indicator is showing a red highlight on the brown line this indicates a SELL opportunity as the value for the indicator is now +100 which means an overbought condition is now the case. The opposite for a BUY will be the case. When the ProCCI indicator is showing a yellow highlight on the brown line this indicates a BUY opportunity as the value for the indicator is now -100 which means an oversold condition is now the case. See the money management rules above to see how to use the ProCCI to exit a trade.
Trade Example 2: We see a white hot trade arrow and then a down bar. This is a very good trade opportunity and a trade is opened after the down bar closes. We use the “time to next bar indicator" to give us a heads up when the current bar is closing and we can get in right away.
Trade Example 3: We see a RED arrow indicating a High Probability Trade may occur. The trade was opened after the following bar was a DOWN bar which is bearish and we are now in a SELL trade

Trade Example : EURUSD 1 minute Chart
Here is a great example of 2 short term scalping trades on the EURUSD 1 minute time frame. You can see the RED arrows appeared and then if you did a SELL after the next bar which was a bearish (Down bar) it would have been easy to get 5 pips on each of these. The RED and the BLUE arrows signify high probability trade set ups are approaching.

Trade Example : EURUSD 5 minute Chart
Perfect Trade Entry and Exit - Entry #1 has the RED down arrow which indicates a SELL trade is approaching. The next bar is a down bar so we can safely enter this trade. This would have made 30+ pips. Entry #2 also has the RED arrow down which means a sell is imminent. We get a down bar following the RED arrow so we could enter a SELL trade. A perfect exit would be to let this trade go all the way down to the very next resistance line (green line) and close the trade at that point. This trade would have made about 60 pips. Whenever possible let the trade run all of the way until the next support/resistance line is touched so you can get the most possible pips You could also have exited this trade when the ProCCI ( not shown here) touched 0 for a conservative exit or waited for it to reach -100 for an aggressive exit. Either way this would have been profitable.

Conclusion
The 30 pip indicator used along with this simple trade set up is an excellent way to trade. Anyone can learn it as 90% of the trade logic is done for you inside the 30 pip indicator. Even a person new to forex trading can see the arrows on the chart and learn to trade this powerful yet simple method.
Platform: MetaTrader 4
Category: Trading Strategy
Author: bestmt4brokers.com
No comments:
Post a Comment